Innovation-abm: an agent based model of innovation creation and diffusion
Daniele Ietri and Marco Lamieri*
October 2004
*“Dipartimento Interateneo Territorio, Politecnico e Università di Torino”
(
ietri@econ.unito.it) and “Dipartimento di matematica e statistica applicata
alle scienze umane Diego De Castro, Università degli studi di Torino”
(
lamieri@econ.unito.it). Piazza Arbarello 8, 10122 Torino Italy
|
Market is the only result of the behaviour of agents, as we can
find other forms of contact and communication. Many of them are
determined by proximity conditions in some kind of space: in this
paper we pay a particular attention to relational space, that is the
space determined by the relationships between individuals.
The paper starts from a brief account on theoretical and empirical
literature on social networks. Social networks represent people and
their relationships as networks, in which individuals are nodes and
the relationships between them are ties. In particular, graph theory is
used in literature to demonstrate some properties of social networks
summarised in the concept of “Small Worlds”. The concept may be
used to explain how some phenomena involving relations among agents
have effects on multiple different geographical scales, involving both
the local and the global scale.
The empirical section of the paper is introduced by a brief
summary of simulation techniques in social science and economics as a
way to investigate complexity. The model investigates the dynamics of
a population of firms (potential innovators) and consumers interacting
in a space defined as a social network. Consumers are represented
in the model in order to create a competitive environment that
pushes enterprises into innovative process (we refer to Schumpeter’s
definition): from interaction between consumers and firms innovation
emerges as a relational good.
|
Contents
List of Figures
1 Introduction
In this paper
we focus on both innovation and its relational properties. The simulation model
presented investigates the dynamics of a population of firms and consumers
interacting in a relational space, defined as a social network. Consumers are
represented in the model in order to create a competitive environment pushing
enterprises into innovative process (we refer to Schumpeter’s definition): from
interaction between consumers and firms innovation emerges as a relational
good.
In section 2 a Schumpeterian definition of innovation is introduced and
we present some insights on the role of knowledge and relations in the
innovative process of firms. Section 3 starts from a brief account on theoretical
literature on social networks and graph theory. Social networks represent
people and their relationships as networks, in which individuals are nodes
and the relationships between them are ties. Moreover, graph theory is
introduced in order to represent the network, which will be populated of
both firms and consumers. Finally, the “small worlds” phenomenon is
presented and implemented as an algorithm useful to define how relationships
are formed. Finally a model drawn from literature is presented as an
example.
The empirical section of the paper is introduced by a brief summary of
simulation techniques in social science and economics, as a way to investigate
complexity. The model is then presented, with a detailed description of its main
features. In conclusion of the paper, some early results of simulation runs are
presented and discussed.
2 Firm and innovation, knowledge and networks
In this section we will provide a brief account of part of the theoretical
debate on the role of innovation in the economic system. We will try to
demonstrate, always from a theoretical point of view, why innovation is mainly a
matter of relations and why we need to study networks of firms with our
model.
2.1 Innovation, firm and economic growth: the schumpeterian heritage
The theories of economic development of “neo-classical” origin (or, as is often
said, mainstream) have often considered technological innovation as a simple
factor in a production function. Nevertheless Karl Marx in his “Zur Kritik der
politischen Ökonomie” (1859) recognised in the technical progress the main reason
for development. According to the German economist, in fact, competition forces
entrepreneurs into the innovative process, which consists in the exploitation of
what is made them available by science.
The role of innovation has been studied in-depth by Schumpeter (1934), who
focused in particular on the role of the entrepreneur. Schumpeterian entrepreneur
is characterised by exceptional qualities of force and sharpness and is the real
author of the innovative process, as she is able to introduce innovations in the
productive processes. Schumpeter’s model formalises three steps of the innovative
process. First, the invention, that applies to the outcome of research activity.
Second the innovation itself, that occurs when invention is applied in
the productive process. Third, imitation, that is the attitude of other
entrepreneurs who imitate other’s invention. In schumpeterian approach
innovation is the re-organisation of productive factors in new combinations:
the outcomes may concern the introduction of a new good or productive
process, the opening of a new market, the discover of a new source of
primary goods, the emergence of a new form of organisation of the firm
.
Innovation has characteristics of a “creative disruption” force, as it determines
the rise of new activities and productive sectors to the detriment of old sectors
and technologies. Moreover, the nature of the innovative process itself, as
described by the Austrian economist, based on a perpetual dynamics of innovation
- imitation - innovation, is cause of economic growth and mostly of the cyclical
instability of the economic system. Innovation, in fact, is introduced by few early
adopters and is diffused in the system by the imitators. In the aggregate
dynamics of the model presented in this paper we will look for those cyclical
behaviours: we will test if a sort of “bangwagon effect” as described by
Shumpeter
will emerge from the simulation.
The schumpeterian approach inaugurated a long lasting theoretical
debate: some recent works of the economists of the so called Austrian
school are interesting for our theoretical framework. In particular the
writings of Friedrich Hayek are fundamental for the attention they pay
to the role of technical development and knowledge in the firm (Hayek,
1937). The main role of information and its transmission and diffusion
dynamics is underlined by Hayek in a paper in which he explains how
people keep specific pieces of knowledge, which are uneasily transferable to
others.
2.2 Knowledge, interaction and the innovative process
The ways in which knowledge is produced and diffused play a fundamental role in
the innovative process. Knowledge is often part of the know-how peculiar of a
subject or an organisation. In order to define the framework for the simulation
model presented below we will briefly present some definitions of knowledge and
hypothesis on its diffusion dynamics.
Knowledge is very heterogeneous according to its nature and scope: it can be
very abstract or applied, it can be used in a very technical or general way
(both engineering and philosophy are forms of knowledge). According
to the way it is diffused, Polanyi (1967) individuates two main kind of
knowledge:
- codified knowledge: easily transferable and accessible to everyone who
knows its specific language (or code), it can be sold or appropriated
(i.e. through patents);
- tacit knowledge: is embedded in an organisation or community, it can
be transferred only through personal relations and it can’t sold.
If we admit the existence of a such kind of knowledge we recognise that
at least part of the knowledge involved in the innovative activities of
firms has a tacit nature. As this kind of knowledge can be transferred
through personal relations, innovation becomes a relational activity, in
which relations and proximity between firms are needed. Relationships are
then necessary in order to allow external knowledge to be used in the
productive processes inside the firm, especially when tacit knowledge is
involved. Imitation is possible, but many relationships are needed in order
to internalise processes taken from the activities of other firms: this is
why in our model firms would be able to imitate only the most diffused
goods.
More in general, innovation and the production of knowledge is
a “localised” process: proximity matters, in relational and spatial
terms .
That’s the reason for the use of social networks in order to investigate innovation
dynamics among a population of firms.
3 Firm and relationships: small worlds and social networks
In this section we introduce a more methodological issue: if we investigate
relations, a topological definition of relationships is needed in order to build a
simulation model. The necessary theoretical background is defined by three main
concepts:
- social networks, as a field of research that has studied in-deep the form
and dynamics of the relationships among people. We will simply draw
some concepts from literature and apply them on the relations between
firms;
- graph theory, as a way to represent topologically networks and define
measures useful to get some of their main characteristics;
- “Small Worlds” phenomenon, from which we derive a theoretical
framework (and an algorithm) in order to simulate the creation and
dynamics of relationships between agents.
3.1 Social networks: why the world is a “small” world?
Some features of social systems may be studied through the theoretical framework
of physical systems. As an example, the notion of distance typical of physical
systems can be adapted in order to suite the characteristics proper of relationships
between people. The use of distance reveals also some critical difference
between the two systems. A fundamental property of physical systems is
that randomly chosen three points in the space and connecting them by
segments we form the sides of a triangle. The sum of the length of the
two sides is always greater than the measure of the third side. In social
systems the concept of distance can be used to represent the strength of the
relationships intertwined between people. The smaller is the segment
connecting two agents, the strengthen will be their relationships. Social
systems violate the triangle property: a subject may in fact entertain
very strong relationships (the segments connecting her acquaintances are
very short) with two subjects that do not share any relation (there’s no
segment connecting them). An individual may belong to separate groups of
acquaintances among which there’s no relation: in this case the subject is the only
connection between the two groups. We will call those distinguishable groups
of acquaintances clusters: they are for examples the family, groups of
friends, colleagues and other groups in which people participate for different
purposes.
The “Small World” phenomenon is part of the studies on social networks. In a
social network, individuals are represented, conceptually and graphically, as nodes
of networks formed by the subjects themselves and the relationships connecting
them.
Theories are not easy to test on large networks and with diffuse connections,
as the computational work increases with the raise of the population. Social
networks show non local properties so that it’s not possible to analyse global
features using exclusively local analysis.
We should not regret that the empirical analysis is made difficult as
people hardly are able to take account of their own contacts, if not with
methods requiring time and hard work. Each research is finally particularly
conditioned by the given definition of friend or acquaintance, which may
vary from knowing other person’s name to relationships involving mutual
trust.
As the critical questions exposed above showed, researches on these
topics encounter many difficulties, in particular on the empirical point of
view.
3.2 Graph theory
In order to represent social networks and the Small Worlds phenomenon we
should briefly introduce some concepts of graph theory, following Watts (1998).
We will define graph any set of points (vertexes or nodes) tied by lines (links or
edges). The number of points defines the order of the graph, while the number of
lines defines its dimension. Some properties of graphs useful for this work
are:
- the characteristic path length L, defined as the median of the means
of the shortest path lengths connecting each node to all others nodes:
randomly chosen two subjects in the social network, we can expect
being L the length of the shortest path between them;
- the cohesion d, the probability that nodes linked to any defined node
would be connected to each other . This property is also defined
clustering coefficient and is the ratio between the number of edges in the
neighbourhood of a node and the total number of theoretically possible
edges in that neighbourhood. It is a proxy of the tendency for a graph
of forming clusters, sub-groups of nodes.
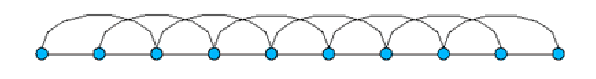
Thanks to the analysis of graphs itis possible to study the relations between
local and global level of the network. At the local level the graph has nodes
connected in a way determined only by the neighbouring conditions, with each
node linked to its neighbouring nodes: in Figure 1 this condition is graphically
presented.
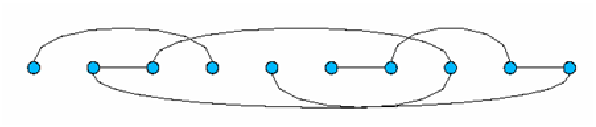
If the edges are randomly determinate we obtain a random graph (global
graph), represented in one-dimension in Figure 2.
If nodes represent the agents and graph formed by nodes and ties represent
social networks, then we justify the use of terms such as “local” and “global”. In a
structure such as the one of the regular graph, each node (agent) is able to
interact only with the k agents forming its neighbourhood: the space determines
the possibility to interact of each agent that may operate only in a local context.
The agents interacting in a random graph may establish relationships apart
from the spatial structure of their neighbourhood, acting in a pure global
scale.
3.3 Small worlds: networks between order and chaos
Defining from end to end the possible structure of graphs, on one end
one-dimensional structures perfectly correlated and on the other multi-dimensional
structures perfectly un-correlated, we can explore (Watts, 1998) the intermediate
configuration, looking for “small worlds” graphs, characterised by high levels of
both accessibility and cohesion.
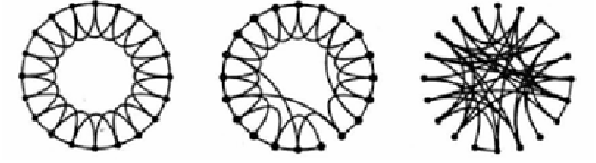
We take into consideration, apart from the sociological meaning of the
network, a circular structure that, varying a parameter  gradually changes from
a determined graph into a completely random graph (Figure 3). Watts (1998)
presents some results with respect to characteristic path length and clustering
coefficient measures. When is very small ( = 0.01) the characteristic path
length gets immediately lower, while the clustering coefficient lowers only for
higher levels of ( = 0.1). In the interval (0.01 < < 0.1) the graph presents
both cohesion and accessibility.
gradually changes from
a determined graph into a completely random graph (Figure 3). Watts (1998)
presents some results with respect to characteristic path length and clustering
coefficient measures. When is very small ( = 0.01) the characteristic path
length gets immediately lower, while the clustering coefficient lowers only for
higher levels of ( = 0.1). In the interval (0.01 < < 0.1) the graph presents
both cohesion and accessibility.
The accessibility of the network increase while the parameter increases and
is due to the way in which ties are recalculated. If the number k of connections is
fixed, while increases the dispersion of ties grows.
For low levels of , new ties connect two nodes which already share a
neighbourhood with a third one: a triangle is formed and the path within
them is scarcely reduced. We will define this feature as a “shortcut”.
While grows new ties will instead connect very distant nodes that do
not share their neighbourhoods. In this way the new links created will
connect groups of agents, reducing the characteristic path length of the
network.
Parts of the graph and groups of nodes which otherwise would be separated
are connected thanks to this feature. A few shortcuts are needed in order to
obtain a sensible reduction of the characteristic path length: in fact, it lowers
immediately for low levels of the parameter.
The implementation of graph theory in order to explain the innovation
diffusion is a fertile ground of study; for example Cowan and Jonard (1999) focus
on knowledge diffusion through face-to-face relationship and on the relationships
developed on networks structures. It is assumed that subjects are part of a
network and detain various kinds and amounts of knowledge. For each step one of
the edges of the network is randomly chosen and the subjects connected by that
edge compare their knowledge. If for example one of them detains more
knowledge of the kind a and the other of the kind b they get involved in an
exchange of knowledge. The parameter in the model is the probability
p that a link is destroyed and re-wired. For p varies, the measures of
characteristic path length and cohesion are calculated: for p included between
0.005 and 0.01, the model shows high cohesion and low characteristic
path length. Cowan and Jonard measure the medium level of knowledge
detained by each subject: the level is particularly high in the same interval
(0.005 < p < 0.01). We may say that cohesion and path length act in
opposite directions: cohesion is responsible for a quick diffusion among
neighbours (at local level) while path length shows how information (or
innovations) is able to reach and diffuse far from the point in which have been
originated.
4 An agent based model on innovation creation and diffusion
The analysis of innovation diffusion within a social network present some
analytical difficulties, due to the emergence of global properties not predictable on
the basis of local interaction. Computer simulations seem to be suitable
in studying those phenomena, which undoubtedly present elements of
complexity.
4.1 Simulation techniques for social sciences and economics
According to Langton (1992) one of the fundamental aspects in the analysis
of complex phenomena is the distinction between linear and non-linear
systems.
Dealing with linear systems the behaviour of the whole system exactly
corresponds with the sum of its constituting parts. Obeying to a principle called
by Langton “principle of superposition”, linear systems may be studied with a
reductionistic method. The system is divided into simpler parts, whose
understanding is enough in order to understand how the system works
as a whole. In this case it is possible to say that the system is “just”
complicated.
Non linear systems do not respect the superposition principle: even if the
observer has understood how each part works, it won’t be possible for him to
understand the system as a whole. This kind of system is complex. The
fundamental difference between a complicated and a complex system is the
importance of connections between parts, which would fail if parts are considered
separately.
Dealing with a system presenting this kind of features, the research
method has to be deeply revised in comparison with the analytical tradition.
Instead of starting from the system as a whole in order to decompose it and
understand its parts, it would be more opportune to start from its constitutive
parts.
Complex systems show other properties, such as emergence. If we define each
part’s internal and interaction rules, the outcome of the system as a whole
may be different from the bare sum of its parts. Coherent behaviours
not defined a priori may spontaneously come out from the aggregate
dynamics. A property is defined emergent if it clearly results from the
behaviour of the system, even if it has not been defined before in its parts’
rules.
The need to study complex system “bottom-up” lead to the diffusion of agent
based simulations methods, where agents are comparable to what has since
defined parts. For a thorough analysis of agent based simulations in social science,
economics in particular, we refer to Gilbert and Terna (2000) and to Tesfatsion
(2002) .
Following Parisi (2001):
Simulations carry out a synthesis of reality, where synthesis
means starting from elements to study how they interact and
the emergent behaviour. A simulation stems from a group of
components of a system and, through the elaborations of a
computer, shows how the interactions between elements yield
to the overall system with its specific properties. Simulations
are based on the assumption that reality can’t be explored just
through the analyses of its components, but is necessary to rebuild
it beginning from its constructing components.
Simulation models are methods used to comprehend reality halfway between
models expressed by language and mathematical symbols. Mathematical models
appear to be too much rigid, as they don’t allow to adequately highlight the
behaviour of parts composing the model without overloading them exceedingly
complex rules. Verbal models are suitable to be more flexible, but are unfit for
providing quantifiable results: even if they overtake the rigidity of mathematical
models, they are surely less rigorous.
A simulation model does not use words or mathematical symbols: the
phenomenon is described with a formal language suited for the computer. The
computer does calculation and provides the results for the experiment. In
this way the computer works like a sort of virtual laboratory through
which the scientist can verify his hypotheses, manipulates variables and
constraints of the model and afterwards observes the outcome on the
screen.
4.2 Overview of the model
The empirical part of the paper is an agent based simulation model that
tries to describe the economic law that lead the enterprise into an
innovative process. The model describes how the innovations are created
and the dynamics of knowledge spreading to other enterprises via
imitation .
From a technical point of view we use Swarm (http://www.swarm.org) as
agent based simulation framework to develop the model and implement it in Java
(http://java.sun.com). Swarm has been chosen because of its diffusion and the
presence of a strong community of users; we believe is very important to create a
model easily understandable by other scientist and Swarm is somehow a base
framework. In order to visualize the simulated world of firms and customers
interconnected, the library Jung - Java Universal Network/Graph Framework
(http://jung.sourceforge.net/) has been used.
The simulation represents the economic world using two different populations
of agents:
- firms
- consumers
The focus of the model is the enterprise which is the potential innovator:
consumers define a competitive environment for the enterprises in order to push
them into an innovative process.
In the definition of innovation (or better “innovative process”) we refer to the
field of study leaded by Schumpeter. We consider the innovation as a relational
good, and we will show that the innovation’s value emerges from the interaction
between firms and consumers. We refer to innovation as the process of
discovering something new; we refer also to the imitation process that
is crucial in order to spread knowledge in the economy trough a social
network.
We focus especially on two theoretical concepts.
- the role played by the tacit knowledge in the innovative process. This
kind of knowledge is transferable only by face-to-face relationship via a
non codified transmission. Tacit knowledge is idiosyncratic of a specific
time, place and group of people.
- social relations are expensive in term of time and effort both for
firms and for consumers; in order to draw a social network we try to
justify the all the relations in terms of competitive advantage or higher
knowledge obtained by the members.
The goal of the simulation is to build a model useful to understand the
innovation process from two different points of view.
- From a micro perspective we investigate:
- why the firms decide to innovate;
- how the innovation process affects the enterprise’s activity;
- how innovation spreads via imitation.
- From an aggregate perspective we look for emergent phenomena coming
from the interactions of the simple agents described in the model, the firms,
and we investigate:
- innovations and imitations affect on the economy as a whole;
- business cycles dynamic of the simulated economy;
- technological progress dynamic at a macro level: is it constant or
does it shows, jumps, radical innovations followed by incremental
ones?
4.3 The consumer side
Consumers define the environment for the enterprises but they are not
object of analysis. Consumers have heterogeneous preferences and bounded
rationality.
4.3.1 Consumer with heterogeneous preferences
The preferences of the consumers are defined by a numeric array, each value of
which is a “feature” of the product that the consumer would like to have. Every
consumer has its own preferences randomly generated at the beginning of
the experiment using an array of integers with a length defined by the
initPreferenceLength parameter. The domain of each value is defined by the
parameter preferenceDomain. For instance a consumer preference could be
defined as a 3 digit string using an alphabet of 12 possible values for each
digit.
![[11;0;3]](innovation3x.png)
Every consumer looks for a product as much similar as possible to its
preference.
4.3.2 Consumer and bounded rationality
For a theoretical perspective on bounded rationality in economics we refer to
Ludwig von Mises (1949) and Camerer (2004). The bounded rationality
of the consumer is modelled using a social network; the consumers are
vertex of a graph and are connected with the enterprises via undirected
edges. If a consumer is connected to a firm with a edge it means that the
consumer knows that firms and, most important, she knows the product
offered.
The edges between consumers and enterprises are dynamics and are
modified during the simulation as described in the section referring to
the dynamics of the system. The consumer buys one product at every
tick and she chooses the one closest to her preferences among the known
products.
4.4 The firm’s side
4.4.1 The technology is embedded in the products
Each firm produces one product, represented by a numeric array of a defined
length. Each value of the array represents a technological feature of the product:
in this way each product is potentially different from each other product. The
parameter initProductsLength defines the initial length of the products for all the
firms. When the simulation starts each firm is characterized by a product defined
by many features chosen randomly within a domain defined by the parameter
featureDomain.
For instance a product could be defined as a 4 digit string using an alphabet of
12 possible values for each digit; in this case a possible product would
be:
![[1;11;0;3]](innovation4x.png)
4.4.2 The financial aspects, a basic accounting framework for the
firm
The firm has a basic accounting capability; the firm has an initial asset defined by
the parameter initialFirmAsset and at every tick of the simulated time the firm
faces costs and revenues.
Costs are divided in:
- fixed costs, defined by the parameter fixedCost; they are subtracted
from the firm’s asset at every tick. All the firms pay the same fixed
costs;
- variable costs; they are due to the innovative process and are paid
only if the firm decides to innovate. There are two type of variable
costs:
- cost for internal research: in case the firm decides to innovate
investing in research a parametric defined cost researchCost is
charged, this is generally an high cost;
- cost for imitation: in case the firm decides to imitate another firm’s
product a parametric defined cost imitationCost is charged, this
is generally a low cost.
The revenue comes only from selling activity: when a firm sells a product, it
earns a predefined amount of money. The revenue depends only on the number of
products sold.
4.4.3 Internal research and imitation: the innovations strategies
The firm has also an innovation strategy; firms can have a vocation to imitate or
to be engaged in internal research. Each firm’s innovation strategy is decided
randomly (with 0.5 probability from a normal distribution) at the beginning
of the simulation. At every tick the firm decides its innovative strategy
according to its vocation; an “imitation strategy” firm will always innovate by
imitation and a “research strategy” firm will always use internal research to
innovate.
4.5 Model’s dynamic
4.5.1 The environment in which firms and consumers interact
Firms and consumers are connected each other within a social network. The
network is defined topologically as a graph with vertex (firms and consumers) and
edges (their relations). This is a relational space and not a geographical or
physical space.
Firms are connected among them using a small world graph as defined by
(Watts, 1998) and their edges are static. This kind of model has been chosen for
its statistical property (it shows “Small Worlds” properties) as described in
chapter 3.
The connection between firms and customer is dynamic, evolves over time, and
is defined randomly with a given probability. The formalization of the ties
between firms and consumers is randomly generated at the beginning
of the simulation and refreshed every n tick where n is defined by the
parameter edgeUpdateFrequency. At every refresh the following algorithm is
performed:
- for every consumer the existing edges are destroyed with a probability
p1 defined by the parameter edgeDistructionProb;
- for every consumer, excluding the existing edges not destroyed in phase
1, new edges are created using a probability p2 and testing it for every
possible link between a customer and all the existing firms; p2 is defined
by the parameter edgeCreationProb.
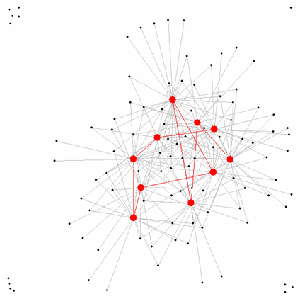
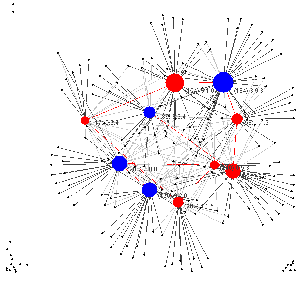
The figure 4 show a world with 100 consumer and 10 firms. The model
connecting the firms has beta 0.1 and the graph degree is 2; the probability of
edge creation between consumer and firms is 0.2. To visualise the graph the
Fruchterman-Reingold algorithm has been used.
4.5.2 Dynamics and interactions
Each consumer looks for the best product to buy selecting among the firms she
knows, then chooses the product that better fit its preference. At every
simulation’s tick each consumer buys one product ad generates revenues for the
selling enterprise. In order to choose the better product, the consumer compares
her preferences with all the products she knows and chooses the one that has
more common values. For example consider a consumer preference and 3
products:
![Consumer pref erences [1; 3;7]](innovation6x.png)
![P roduct 1 [5;9;1;4] ==> 1 match](innovation7x.png)
![P roduct 2 [6;9;7;5;7;1;2;3] ==> 4 match](innovation8x.png)
![P roduct 3 [2; 11;4;8;3;1;10; 5] ==> 2 match](innovation9x.png)
Product 2 will be chosen and bought by the consumer. It is easy to see that
longer features strings have higher probability to be chosen; if we remember that,
starting from an initial length equal for all the products, firms can add features by
innovation, it is easy to understand how we model the competitive advantage
given by the innovation.
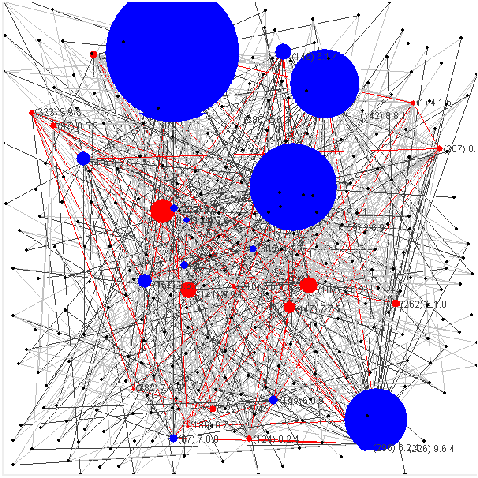
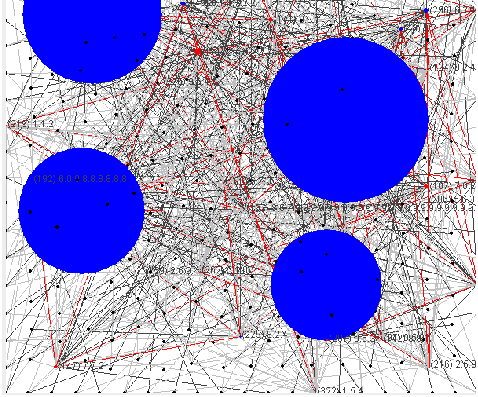
The network graph shows relations among firms and between firms and
customers. The firms are connected among them by red edges. The firm’s vertex
colour depends on the strategy used by each firm to innovate. Blue vertexes are
imitators and red vertexes are innovators. When a firm innovates, it becomes
green.
The numbers displayed next to firm’s vertexes show the firm’s identification
number, in bracket, and the feature of its product.
The customers are gray vertex and they are connected to the firms by
gray edges. Each customer knows only the firms which is connected to
by an edge and at every tick decides to buy from one of the firms he
knows. The link connecting the consumer with the firm she buys from
changes its colour into dark gray, while all the other edges remain light
gray.
4.5.3 The innovative process
Innovation, when occurs, adds a value to the product features string,
according to the strategy used by the firm to innovate. We have two possible
strategies:
- internal research: if the enterprise decides to innovate through internal
research pays the amount defined by the parameter internalResearchCost.
The research activity will then give a result with the probability defined by
the parameter discoveryProb (about 0.8). We have two possible
scenarios:
- internal research gives no results: the firm pays the cost for
research and has no benefit at all;
- internal research is successful: the firm pays the cost for research
and then adds a new feature (number) to its product (array of
values). The feature is randomly chosen within the domain.
- imitation: if the enterprise decides to imitate, it pays the cost of imitation
defined by the parameter imitationCost. In order to imitate, the firm looks
to the products of the other firms it knows (which it is connected to in the
network). The firm then chooses the feature most diffused among its
neighbours and adds it to its product’s feature list. If two or more features
have the same diffusion within the neighbours one is chosen randomly. As an
example the following graph shows the firm number 14 (the green one)
imitating the feature “2” from its neighbours (firms number 3 and
16).
![Firm 3 [9;2; 0;2]](innovation12x.png)
![F irm 16 [2;5;9;4]](innovation13x.png)

![F irm 14 [6;2;4;2]](innovation15x.png)
Usually imitation is cheaper than internal research and is more efficient in
the model, as it outcomes with a certain result while research is only
probable.
Innovating, and then adding features to the products, gives to the
innovative enterprise a competitive advantage: its product is more likely
to match consumer’s preferences and then will probably sell more. The
firms that perform internal research discovers something new that can
provide competitive advantage regard to other firms in satisfying customers’
preferences.
The main issue is: when the enterprise decides to innovate and why?
According to Schumpeter we believe it happens for a competitive reason; the firm
looks for higher profit or better performance. In accord to this theory we define
two possible rules that lead a firm to innovate:
- no past sell: a firm innovates if in the last tick it sells nothing. If the
firm sells nothing it is probable that its product is not satisfactory for
the consumers;
- low market share: a firm innovates if its asset is lower than the 70%
of the average asset of the neighbouring firms. If the firm connected
have higher assets it means they sell more and that the market gives
the opportunity to increase the revenue by finding a better product.
An obvious conclusion is that innovation will lead to better economic
performance.
It is important to remember that the kind of innovation (imitation or internal
research) used by each firm is decided by its vocational innovative strategy as
described before.
5 The outcomes of the model
From an aggregate point of view many aspects could be analysed using the data
generated by the described model. In this section we would like to focus
on:
- real business cycle in the simulated society;
- technological progress trend within the simulated society;
- innovation diffusion process.
5.1 The emergence of real business cycle in the simulated society
As a fist example we outline how a very simple configuration of the model
provides a synthesis of the overall features. We see that firms are involved into the
innovative process, relationships between enterprises and customers are activated;
moreover, this experiment shows how an aggregate cyclical behaviour
emerges.
In the example shown in Figure 7, the network is populated with 30 customers
and 10 enterprises. Fixed and research costs as well as sell revenues are very low
(respectively 1, 3 and 1) and the simplest innovation decision criterion is
implemented (firms innovate if in the last time step no sell occurred)
.
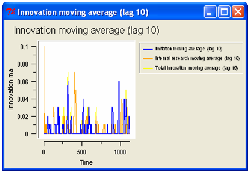
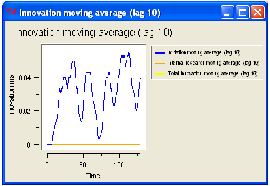
First of all, innovation occurs: enterprises do innovate (numbers/features
are added to the simple string describing their products), via internal
research and via imitation. This is clearly visible through the dynamics
of products array length shown on the graph and through the value of
innovation moving average. The effect of relationships on imitation is
clear, as the most diffuse feature will be reproduced into the imitating
neighbourhood.
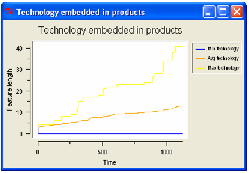
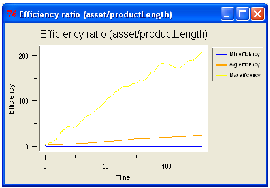
The technological progress is represented by the average length of the products
features. The graph on the left shows the maximum, minimum and average length
of the features; the graph on the right is a measure of efficiency of the
technology in economical terms. The efficiency ratio for the firm i is computed
as:
The trend is upward sloping and it shows how the simulated society is
innovating constantly over time.
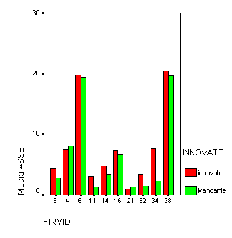
It is easy to verify that innovation gives to the firm a competitive power, that
is expressed in term of a higher asset. The graph shows the average asset of each
firm when it decides to innovate and the average asset when the same firm is not
innovative.
Consumers, in this simple example, effectuate their buying decision comparing
the products offered by the different firms which they are connected with. Links
are activated at each time step and some firms have notable growth of
their asset (the size of the circles, which describe firms on the graph,
grows).
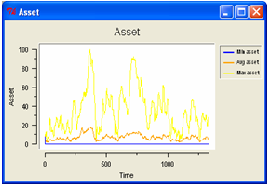
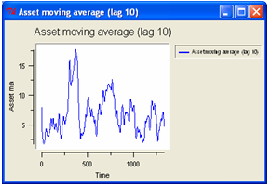
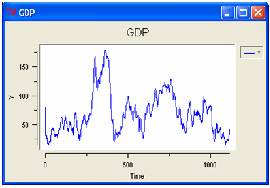
The Figure 10 shows a growth path generated by the model described. The
graph on the left shows the maximum, minimum and average asset owned by the
firms; the right one displays a moving average with lag 10 tick of the asset of the
firms.
There are clear cycles, that could be conduced to the real business cycle
theory: the expansion phases are followed by contractions. It is possible to identify
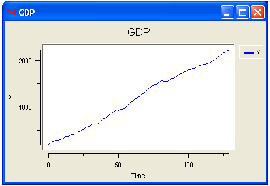
big shifts and small adjustments alternated. Also the gross domestic product of
the simulated economy confirms this outcome.
5.2 Endogenous growth and monopoly
This second configuration
tries to figure out the impact on the simulated economy as a whole of the
innovations made by the enterprises. The effect of the innovations, within this
framework is continuous growth.
The growth of the economy is not created exogenously by a parameter but it is
endogenous and comes from the firm’s interactions. Consumers in the model do
always buy firms’ products: they only decide which product to buy among the
enterprises which is connected to. In this experiment we see how a big number of
consumers provides firms the opportunity to grow their assets through sells
and we will investigate if monopolistic behaviour is coherent with the
model.
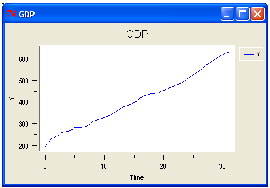
The number of consumers is much higher than the number of firms (30 firms
and 300 consumers): the model shows (ceteris paribus) a behaviour coherent with
its construction, a condition of continuous growth, in firms’ asset terms and for
aggregate mean assets too (Figure 11).
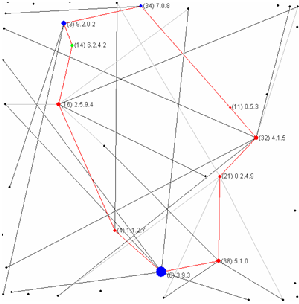
The growth is not homogeneous among firms(Figure 12); some of them, the
most innovative ones, grow faster than others; this difference is due to the
competitive advantage given by internal research, imitation or links with
consumers, that let them gain a major share of the market.
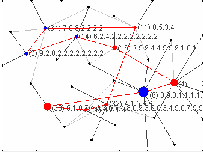
5.3 Research and imitation
An important feature of the model, in the theoretical framework we outlined at
the beginning of this paper, relates to the relational basis of the decision of
firms to commit into the innovative process. In this simulation criterion
1 is selected: a firm decides for innovation if its asset is lower than the
70 per cent of the average asset of its neighbourhood. In the simulation
the
effects of this criterion are fully evident in Figure 13: first of all, when just four
firms out of 30 demonstrate very high levels of their assets and all of them are
imitators, neighbouring firms do regularly choose the innovative process (via
imitation or internal research).
The aggregate behaviour is similar to the imitation process described in
Schumpeter’s works: when a firm achieves a competitive advantage in the market,
reaching a sort of monopolistic position, other entrepreneurs are aware of profit
opportunities and get into the innovation-imitation process. Even if the profit of
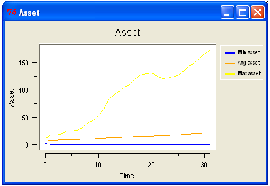
the quasi-monopolistic enterprise do not lower sensibly in the simulation, the
aggregate asset of firms grows, as imitators’ assets do as shown in Figure
14.
The smaller firms try to fill the competitive gap by innovating regularly, in
this way, if they are imitative for vocation, contribute to the spread of the brand
new technology created. The dynamics of the innovation is shown in the Figure
15.
6 Conclusions
In the previous section we described how the simulation model provided some
useful insights for our understanding of firm innovation. Overall, the model shows
how we can obtain coherent aggregate dynamics through the description
of the only rules concerning parts, that in our example are firms and
consumers. Computer simulation generates complex aggregate phenomena, such
as innovation diffusion and business cycles: no description of the rules
proper of this “macro” level was needed, ad it emerged out from bottom-up
dynamics.
We started our work from some theoretical deepening of economic
literature on innovation; some insights on the nature and role of knowledge in
entrepreneurial activity were useful to circumstantiate the subject of the
simulation model. Relational aspects of innovation seemed to be more interesting
and suitable to start the development of a simulation framework, which would be
useful from both the point of view of an economist and a geographer. We then
explained how graphs and social network theory could be adequate in order to
formally describe relationships between firms and consumers. We finally tried
to implement coherently this theoretical framework into a simulation
model.
The first results presented here seem to be encouraging as the main
fundamental features that the model was expected to present did actually
demonstrate to work correctly. First, a competitive market emerges: firms are
forced into innovative processes by the push effect of consumers and we can say
that the model presented has and endogenous growth force. The effect of
relationships and the main properties of the network implemented in the model
produce the expected outcome: innovation (in particular when imitation occurs)
in firms is influenced by the conditions of their neighbourhoods. In general terms,
“proximity matters”. Moreover, some unexpected properties emerge, such
as the formation of cycles and, under certain conditions, monopolistic
markets.
The encouraging results briefly summarised concur to imagine the provision
for a follow-up of our work and future development of the model. First of all, more
and more experiments should be done and new sets of variables have to be tested,
in order get more validations of the model. Moreover the main issue for future
developments will be the implementation of geographical space, beyond that
relational one. In this future research, the use geographical information systems
(GIS) will be fundamental, in particular with an integration between GIS
and simulation software. The combined use of Swarm and some open
source GIS will probably solve much of unsolved technical and theoretical
issues.
References
Cowan, R., & Jonard, N. (1999). Network structure and the diffusion of
knowledge. MERIT Research Memorandum(99-028).
Gilbert, N., & Terna, P. (2000). How to build and use agent-based models
in social science. Mind & Society, 1, 57-72.
Hayek, F. A. (1937). Economics and knowledge. Economica(IV).
Langton, C. (1992, agosto). Vita artificiale. Sistemi Intelligenti, IV (2),
189-245.
Parisi, D. (2001). Simulazioni. la realtà rifatta nel computer. Il Mulino.
Polanyi, M. (1967). The tacit dimension. Routledge and Kegan, London.
Schumpeter, J. (1934). The theory of economic development: An inquiry
into profits, capital, credit, interest and the business cycle. Harvard
University Press, Cambridge Mass.
Tesfatsion, L. (2002). Agent-based computational economics: Growing
economies from the bottom up. ISU Economics Working Paper(1).
Watts, D. J. (1998). Small worlds: The dynamics of networks between
order and randomness. Princeton Studies in Complexity.